an npc codes
Creativity Support for Interactive Narrative

Summary
We are building AI-assisted tools for collaboratively understanding and generating interactive narrative scenarios. We started by creating a graph-based representation of interactive narratives, and calculating metrics to better understand their structure.
Research Topics
Interactive Narrative | Mixed-Initiative Content Creation Tools | Automated Playtesting | Metrics and Representation of Interactive Narrative Structure
Contributors
Elín Carstensdóttir | Sam Snodgrass | Erica Kleinman | Shruti Mahajan | Gillian M. Smith | Casper Harteveld | Camillia Matuk | Steven C. Sutherland | Will Althoff | Magy Seif El-Nasr
Description
In the "Creativity Support for Interactive Narrative" project, we are working to make interactive narrative design tools smarter by developing AI-based understanding of scenarios in order to provide suggestions to the designer. This is known as "mixed-initiative content creation," in which a human and computer work together creatively (Liapis et. al. 2016). Interactive narrative is a new domain for this type of AI, so we are starting from the beginning, developing representations, metrics, and other building blocks for computational understanding of interactive narrative. The initial representation and metrics were presented at AIIDE 2018. The next step is to use these automated analyses to build questions, visualizations, and suggestions for designers!
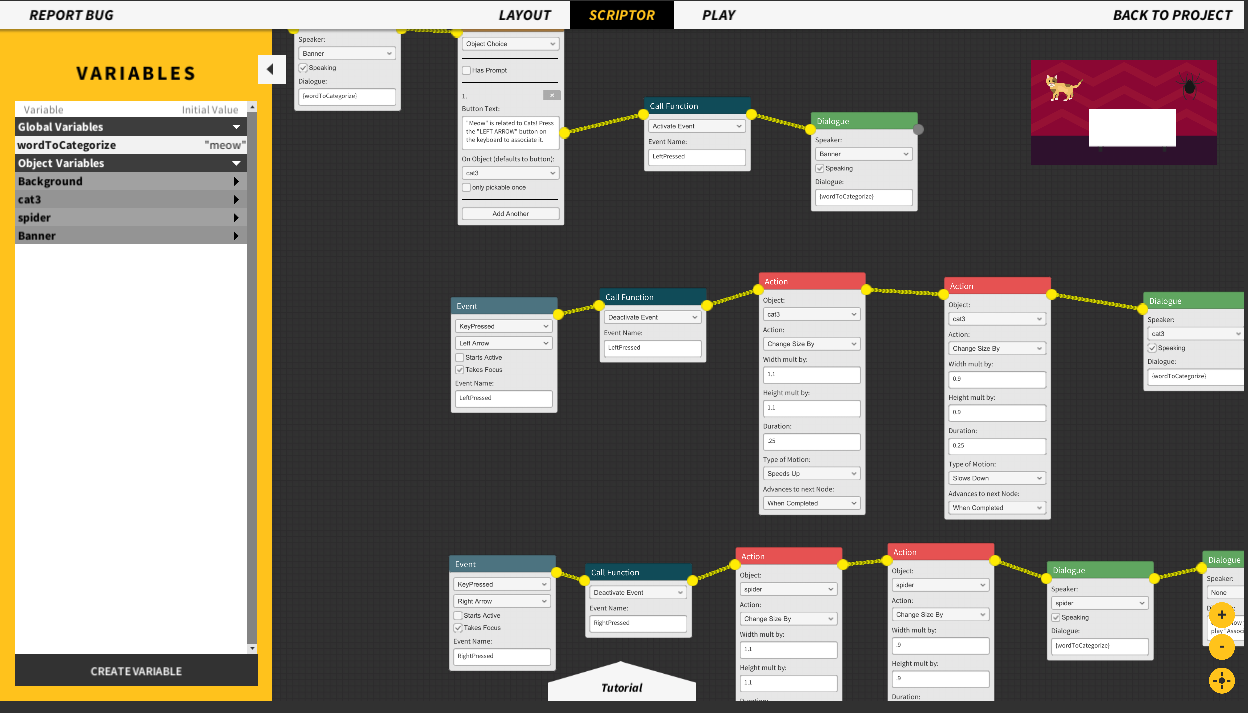
We are working with the 2D interactive scenario design tool "StudyCrafter" (Harteveld et. al. 2016). It provides a graphical scripting language and easy-to-learn interface for creating playful experiences and experiments, which often involve elements of interactive narrative. We have developed a graph-based representation of its scenarios and a set of metrics to better understand their structure. By measuring attributes of the scenario and how it interacts with players, we can begin to determine how to help a designer add, change, or improve aspects of the design.
We divide the metrics into three factors, or categories: narrative structure complexity, interactive affordances, and action space. These factors are designed to measure the structural aspects of the scenarios. Some of our metrics are calculated using automated playthroughs, and some are based on metrics developed by Szilas and Ilea (2014). By examining scenarios individually using these factors, or with specific metrics, designers can augment their own insight into their scenario's strengths and weaknesses. With expressive range visualizations, K-Medoids clustering, and manual analyses, the metrics can guide and simplify manual, qualitative analysis of complex interactive narratives. In continuing work, we plan to enable AI systems to use similar insights and analyses to guide their suggestions.
To be able to calculate metrics on the interactive narratives, we need to have a computational representation that clearly defines and differentiates the scenarios. We defined four types of graph: the scene flow map, script graph, layout graph, and interaction map. These graphs each capture separate information about the scenario, enabling analysis. The graphs are generated automatically from the original StudyCrafter scenario files. The interaction map, in particular, is based on theory by Carstensdóttir et. al. (2017), and is designed to represent the potential flow of interactions between the player and the scenario. It enables visualization, as well as static and playthrough-based analysis, of the ways in which the scenario provides choices and feedback to players.
Links
StudyCrafter
AIIDE 2018 Version of the Analysis Tool
Talk at AIIDE 2018 | Slides
AIIDE 2018 Supplemental Materials
Status
In Progress
References
Publications