AIIDE 2018: "Exploratory Automated Analysis of Structural Features of Interactive Narrative"

Main Project Page
Narrative Creativity ProjectAuthors
Nathan Partlan | Elin Carstensdottir | Sam Snodgrass | Erica Kleinman | Gillian Smith | Casper Harteveld | Magy Seif El-Nasr
Paper
The AIIDE 2018 PaperPresentation
Talk RecordingSlides
Supplemental Materials
AIIDE 2018 Supplemental MaterialsArtifact
The following packages contain an automated analysis tool for interactive narratives built in StudyCrafter, presented at AIIDE 2018. Choose the appropriate version of the executable (or just the source code), depending on your operating system. If you download one of the executable files, you may also want to download the source code in order to see how you might extend the project, and to access additional documentation.
Pre-Built Binaries
Source Code
Unity Project and SourceInstructions
Installation:
On Windows: Drag the "StudyCrafterAssistant" folder to your installation location of choice. Double-click "StudyCrafterAssistant.exe" to run the tool.
On Mac: Drag the "StudyCrafterAssistant.app" to your Applications folder. Double-click "StudyCrafterAssistant.app" to run the tool.
On Linux: Move the "StudyCrafterAssistant" folder to your installation location of choice. Ensure the "StudyCrafterAssistant" executable has execute permissions, and run it.
Usage:
- Place one or more projects made using StudyCrafter into the "StreamingAssets" directory (or a subdirectory thereof) inside the StudyCrafterAssistant directory. The project should be a folder that contains multiple .json files.
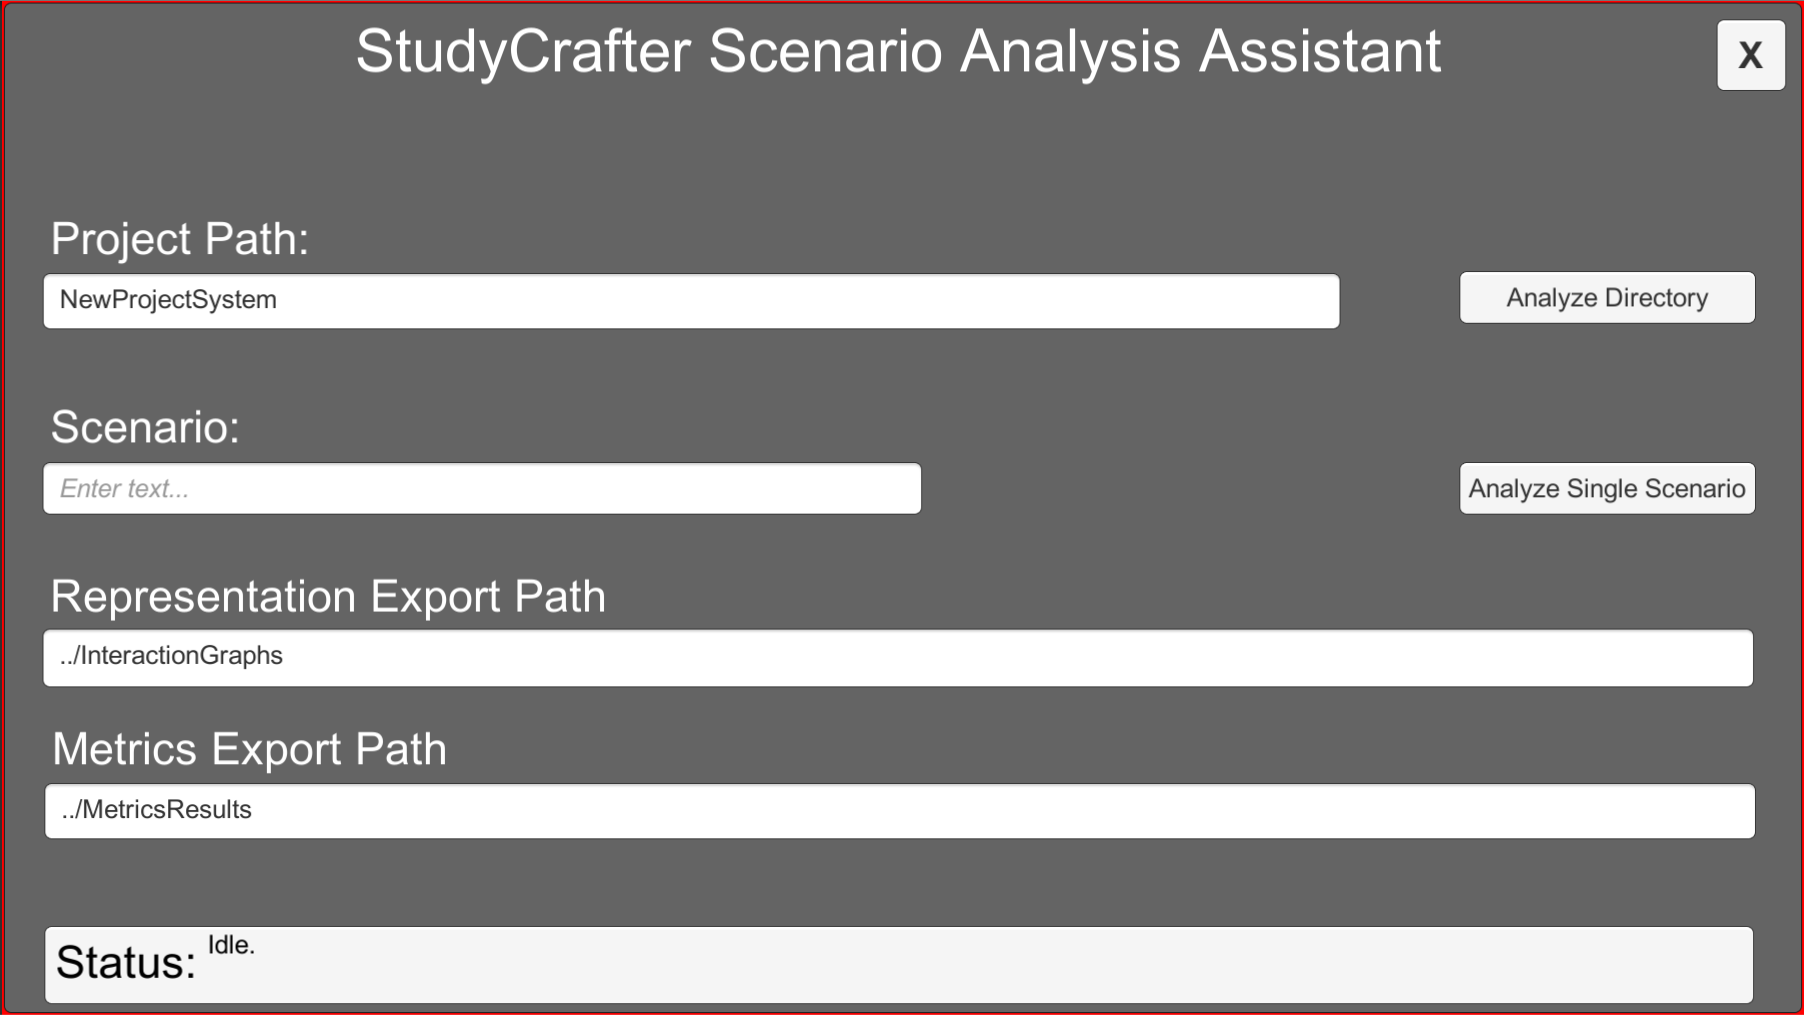
- Open the "StudyCrafter Analysis Assistant" application.
- Specify the output location for the Representation Graphs in the "Representation Output Folder" text input field.
- Specify the output location for Metrics in the "Metrics Output Folder" text input field.
- Specify the folder in which the projects are located, in the "Projects Folder" text input field. Then, if you want to analyze all the projects in that folder, press the "Analyze Directory" button.
- To analyze a single project, specify the name of the project in the "Project Name" text input field. Then, click the "Analyze Single Project" button. Note: Currently, you must analyze an individual project to produce the visual representation graphs for that project.
- You should see the status indicator text return to "Finished" when the analysis is complete. You can then find the output metrics and/or representation graphs in the specified folders.
On a Windows or Linux build of StudyCrafter, these projects are located inside the "StreamingAssets/NewProjectSystem" folder inside StudyCrafter_Data.
Note: On a Mac build, this folder may be accessed by right-clicking on the "StudyCrafter.app," and selecting "Show Package Contents." Inside the package, the projects are located in the folder: "Contents/Resources/Data/StreamingAssets/NewProjectSystem"
Building:
(The following information is only applicable to the "Source" package.)
- Install Unity 2017.04, and either Visual Studio Code or MonoDevelop.
- Open the "StudyCrafterAssistant" folder as a project in Unity 2017.04
- Open the "Asset Store" window in Unity, and find "Json.NET for Unity". Download and import it into your project.
- Open the "TestPCGScene" scene.
- Press the "Play" button to run the tool.
- To build a distributable executable, use the File->Build menu to build to the location of your choice.
The link to this library: Json.NET for Unity
Building the Documentation:
You can use Doxygen to build automatic HTML documentation for this project.
To build the documentation for this project, run "doxygen Doxyfile" in the base StudyCrafterAssistant folder.
The documentation will be found in the "Documentation" folder. The start page is "html/index.html"